背景 Kubernetes 默认提供 CPU 和内存作为 HPA 弹性伸缩的指标,如果有更复杂的场景需求,比如基于业务单副本 QPS 大小来进行自动扩缩容,可以考虑自行安装 prometheus-adapter 来实现基于自定义指标的 Pod 弹性伸缩。
Promethue-adapter的作用 prometheus采集到的metrics并不能直接给k8s用,因为两者数据格式不兼容,这时就需要另外一个组件(prometheus-adapter),将prometheus的metrics 数据格式转换成k8s API接口能识别的格式,因为prometheus-adapter是自定义API Service,所以还需要用Kubernetes aggregator在主API服务器中注册,以便直接通过/apis/来访问。
kubernetes apiserver 提供了三种 API 用于监控指标相关的操作:
resource metrics API:被设计用来给 k8s 核心组件提供监控指标,例如 kubectl top;
custom metrics API:被设计用来给 HPA 控制器提供指标。
external metrics API:被设计用来通过外部指标扩容(后面细讲)
prometheus-adapter支持以下三种API,kubectl top node/pod 是 resource metrics 指标。所以我们可以用prometheus-adapter替代metrics-server
resource metrics API
custom metrics API
external metrics API
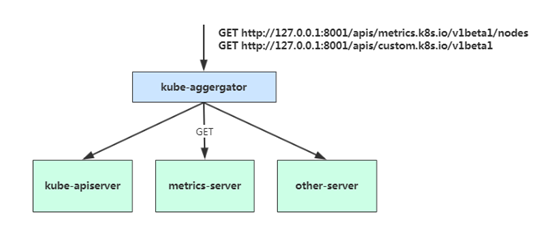
Kubernetes API Aggregation 在 Kubernetes 1.7 版本引入了聚合层,允许第三方应用程序通过将自己注册到kube-apiserver上,仍然通过 API Server 的 HTTP URL 对新的 API 进行访问和操作。为了实现这个机制,Kubernetes 在 kube-apiserver 服务中引入了一个 API 聚合层(API Aggregation Layer),用于将扩展 API 的访问请求转发到用户服务的功能。
当你访问 apis/metrics.k8s.io/v1beta1 的时候,实际上访问到的是一个叫做 kube-aggregator 的代理。而 kube-apiserver,正是这个代理的一个后端;而 Metrics Server,则是另一个后端 。通过这种方式,我们就可以很方便地扩展 Kubernetes 的 API 了。
如果你使用kubeadm部署的,默认已开启。如果你使用二进制方式部署的话,需要在kube-APIServer中添加启动参数,增加以下配置:
1
2
3
4
5
6
7
8
9
10
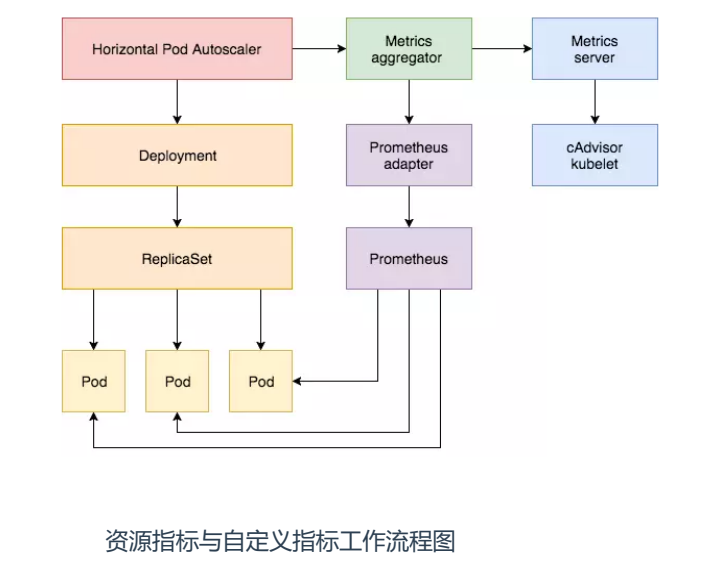
资源指标与自定义指标工作流程
(1) 资源指标工作流程: hpa -> apiserver -> kube aggregation -> metrics-server -> kubelet(cadvisor)
部署Prometheus-adapter 项目地址:https://github.com/qist/k8s/tree/main/k8s-yaml/monitoring
在此github项目上下载custom-metrics-api、prometheus-adapter并应用,custom-metrics-api是创建三个APIService,还有prometheus-adapter是部署 prometheus-adapter Pod,并且添加了v1beta1.metrics.k8s.io APIService用于替换metrics-server
使用以下命令可以看到创建了4个APIService,当他们访问前面的连接的时候会被反代到monitoring/prometheus-adapter svc上,由svc后面的Pod把数据返回会给请求者。
1
2
3
4
5
6
7
8
9
10
11
12
13
14
15
16
17
18
19
20
21
22
[ root @ k8s - master - 01 prometheus - adapter ] # kubectl get apiservice .... v1beta1 . authentication . k8s . io Local True 621 d v1beta1 . authorization . k8s . io Local True 621 d v1beta1 . batch Local True 621 d v1beta1 . certificates . k8s . io Local True 621 d v1beta1 . coordination . k8s . io Local True 621 d v1beta1 . custom . metrics . k8s . io monitoring / prometheus - adapter True 31 h v1beta1 . events . k8s . io Local True 621 d v1beta1 . extensions Local True 621 d v1beta1 . external . metrics . k8s . io monitoring / prometheus - adapter True 31 h v1beta1 . metrics . k8s . io monitoring / prometheus - adapter True 15 s v1beta1 . networking . k8s . io Local True 621 d v1beta1 . node . k8s . io Local True 621 d v1beta1 . policy Local True 621 d v1beta1 . rbac . authorization . k8s . io Local True 621 d v1beta1 . scheduling . k8s . io Local True 621 d v1beta1 . storage . k8s . io Local True 621 d v1beta2 . custom . metrics . k8s . io monitoring / prometheus - adapter True 31 h v2beta1 . autoscaling Local True 621 d v2beta2 . autoscaling Local True 621 d ....
1 2 3 4 5 6 7 8 9 10 11 12 13 14 [root@k8s-master -01 prometheus-adapter]69 d87f556-dcccq 4 /4 Running 0 43 dnode -exporter-249cv 2 /2 Running 0 41 dnode -exporter-4xbm2 2 /2 Running 0 6 d6hnode -exporter-545k4 2 /2 Running 0 41 dnode -exporter-8hchf 2 /2 Running 0 41 dnode -exporter-kxgx7 2 /2 Running 0 41 dnode -exporter-mfwxl 2 /2 Running 0 41 dnode -exporter-qrpv5 2 /2 Running 0 41 dnode -exporter-xhr6b 2 /2 Running 0 41 d6 bc9d8bd9c-86 v5q 1 /1 Running 0 30h 6 bc9d8bd9c-96 t6q 1 /1 Running 0 30h 0 2 /2 Running 0 7 d8h
Prometheus-adapter配置写法 adapter 使用字段 rules 、resourceRules 和 externalRules 分别表示 custom metrics、resource metrics 和external metrics,如本例中
1
2
3
4
5
6
7
8
9
10
11
12
13
14
15
16
17
18
19
20
21
22
23
24
25
26
27
28
29
30
31
32
33
34
35
36
37
38
39
40
41
42
43
44
45
46
47
48
49
50
51
52
53
54
55
56
57
58
59
60
61
62
63
64
65
66
67
68
69
70
71
72
73
74
75
76
77
78
79
80
81
82
83
84
85
86
87
88
89
90
91
92
93
94
95
96
97
98
99
100
101
102
103
104
105
106
107
108
109
110
111
112
113
114
115
116
117
118
119
120
121
122
123
124
125
126
127
128
129
130
131
132
133
134
135
136
137
138
139
140
141
142
143
144
145
146
147
148
apiVersion: v1 kind: ConfigMap metadata: name: adapter-config namespace: monitoring data: config.yaml: | rules: - seriesQuery: '{__name__=~"^container_.*",container!="POD",namespace!="",pod!=""}' seriesFilters: [] resources: overrides: namespace: resource: namespace pod: resource: pod name: matches: ^container_(.*)_seconds_total$ as: "" metricsQuery: sum(rate(<<.Series>>{<<.LabelMatchers>>,container!="POD"}[1m])) by (<<.GroupBy>>) - seriesQuery: '{__name__=~"^container_.*",container!="POD",namespace!="",pod!=""}' seriesFilters: - isNot: ^container_.*_seconds_total$ resources: overrides: namespace: resource: namespace pod: resource: pod name: matches: ^container_(.*)_total$ as: "" metricsQuery: sum(rate(<<.Series>>{<<.LabelMatchers>>,container!="POD"}[1m])) by (<<.GroupBy>>) - seriesQuery: '{__name__=~"^container_.*",container!="POD",namespace!="",pod!=""}' seriesFilters: - isNot: ^container_.*_total$ resources: overrides: namespace: resource: namespace pod: resource: pod name: matches: ^container_(.*)$ as: "" metricsQuery: sum(<<.Series>>{<<.LabelMatchers>>,container!="POD"}) by (<<.GroupBy>>) - seriesQuery: '{namespace!="",__name__!~"^container_.*"}' seriesFilters: - isNot: .*_total$ resources: template: <<.Resource>> name: matches: "" as: "" metricsQuery: sum(<<.Series>>{<<.LabelMatchers>>}) by (<<.GroupBy>>) - seriesQuery: '{namespace!="",__name__!~"^container_.*"}' seriesFilters: - isNot: .*_seconds_total resources: template: <<.Resource>> name: matches: ^(.*)_total$ as: "" metricsQuery: sum(rate(<<.Series>>{<<.LabelMatchers>>}[1m])) by (<<.GroupBy>>) - seriesQuery: '{namespace!="",__name__!~"^container_.*"}' seriesFilters: [] resources: template: <<.Resource>> name: matches: ^(.*)_seconds_total$ as: "" metricsQuery: sum(rate(<<.Series>>{<<.LabelMatchers>>}[1m])) by (<<.GroupBy>>) "resourceRules": "cpu": "containerLabel": "container" "containerQuery": | sum by (<<.GroupBy>>) ( irate ( container_cpu_usage_seconds_total{<<.LabelMatchers>>,pod!=""}[120s] ) ) "nodeQuery": | sum by (<<.GroupBy>>) ( 1 - irate( node_cpu_seconds_total{mode="idle"}[60s] ) * on(namespace, pod) group_left(node) ( node_namespace_pod:kube_pod_info:{<<.LabelMatchers>>} ) ) or sum by (<<.GroupBy>>) ( 1 - irate( windows_cpu_time_total{mode="idle", job="windows-exporter",<<.LabelMatchers>>}[4m] ) ) "resources": "overrides": "namespace": "resource": "namespace" "node": "resource": "node" "pod": "resource": "pod" "memory": "containerLabel": "container" "containerQuery": | sum by (<<.GroupBy>>) ( container_memory_working_set_bytes{<<.LabelMatchers>>,pod!=""} ) "nodeQuery": | sum by (<<.GroupBy>>) ( node_memory_MemTotal_bytes{job="node-exporter",<<.LabelMatchers>>} - node_memory_MemAvailable_bytes{job="node-exporter",<<.LabelMatchers>>} ) or sum by (<<.GroupBy>>) ( windows_cs_physical_memory_bytes{job="windows-exporter",<<.LabelMatchers>>} - windows_memory_available_bytes{job="windows-exporter",<<.LabelMatchers>>} ) "resources": "overrides": "node": "resource": "node" "namespace": "resource": "namespace" "pod": "resource": "pod" "window": "5m" externalRules: - seriesQuery: '{__name__=~"^.*_queue_(length|size)$",namespace!=""}' resources: overrides: namespace: resource: namespace name: matches: ^.*_queue_(length|size)$ as: "$0" metricsQuery: max(<<.Series>>{<<.LabelMatchers>>}) - seriesQuery: '{__name__=~"^.*_queue$",namespace!=""}' resources: overrides: namespace: resource: namespace name: matches: ^.*_queue$ as: "$0" metricsQuery: max(<<.Series>>{<<.LabelMatchers>>})
adapter 的配置主要分为4个: Discovery:指定需要处理的 Prometheus 的 metrics。通过 seriesQuery 挑选需要处理的 metrics 集合,可以通过 seriesFilters 精确过滤 metrics。
seriesQuery 可以根据标签进行查找(如下),也可以直接指定 metric name 查找
1
2
3
seriesQuery: '{__name__=~"^container_.*_total" ,container_name!="POD" ,namespace !="" ,pod_name!="" }'"^container_.*_seconds_total"
seriesFilters:
1
2
is : <regex>, 匹配包含该正则表达式的metrics.
Association:设置 metric 与 kubernetes resources 的映射关系,kubernetes resorces 可以通过 kubectl api-resources 命令查看。overrides 会将 Prometheus metric label与一个 kubernetes resource (下例为 deployment )关联。需要注意的是该 label 必须是一个真实的 kubernetes resource,如 metric 的 pod_name 可以映射为 kubernetes 的pod resource,但不能将 container_image 映射为 kubernetes 的 pod resource,映射错误会导致无法通过 custom metrics API 获取正确的值。这也表示 metric 中必须存在一个真实的 resource 名称,将其映射为 kubernetes resource。
1
2
3
resources: overrides: microservice: { group: "apps" , resource: "deployment" }
Naming:用于将 prometheus metrics 名称转化为 custom metrics API 所使用的metrics名称,但不会改变其本身的metric名称,即通过curl http://$(kubectl get service sample-app -o jsonpath=’{ .spec.clusterIP }’)/metrics 获得的仍然是老的 metric 名称。如果不需要可以不执行这一步。
1
2
3
4
5
# 匹配将任何名称 <name>_total 转换为 <name>_per_second # 例如 http_requests_total 变为 http_requests_per_second name: matches: "^(.*)_total$" as: "${1}_per_second"
如本例中 HPA 后续可以通过 /apis/{APIService-name}/v1beta1/namespaces/{namespaces-name}/pods/*/http_requests_per_second 获取metrics
Querying:处理调用 custom metrics API 获取到的 metrics 的 value,该值最终提供给 HPA 进行扩缩容
1 2 metricsQuery : "sum(rate(<<.Series>>{<<.LabelMatchers>>,container_name!=" POD"}[2m])) by (<<.GroupBy>>)"
metricsQuery 字段使用 Go template 将 URL 请求转变为 Prometheus 的请求,它会提取 custom metrics API 请求中的字段,并将其划分为 metric name,group-resource,以及 group-resource 中的一个或多个 objects,对应如下字段:
Series: metric名称
LabelMatchers: 以逗号分割的 objects,当前表示特定 group-resource 加上命名空间的 label(如果该 group-resource 是 namespaced 的)
GroupBy:以逗号分割的 label 的集合,当前表示 LabelMatchers 中的group-resource label
假设 metrics http_requests_per_second 如下
1
2
http_requests_per_second {pod= "pod1" ,service= "nginx1" ,namespace = "somens" }http_requests_per_second {pod= "pod2" ,service= "nginx2" ,namespace = "somens" }
当调用 kubectl get --raw "/apis/{APIService-name}/v1beta1/namespaces/somens/pods/*/http_request_per_second"时,metricsQuery 字段的模板的实际内容如下:
Series: “http_requests_total”
LabelMatchers: “pod=~"pod1|pod2”,namespace=”somens”
GroupBy:pod
HPA 的配置 HPA 通常会根据 type 从 aggregated APIs (metrics.k8s.io, custom.metrics.k8s.io, external.metrics.k8s.io)的资源路径上拉取 metrics
HPA 支持的 metrics 类型有4种(下述为v2beta2的格式):
resource:目前仅支持 cpu 和 memory。target 可以指定数值(targetAverageValue) 和比例 (targetAverageUtilization) 进行扩缩容 HPA 从 metrics.k8s.io 获取 resource metrics
pods:custom metrics,这类 metrics 描述了 pod 类型,target 仅支持按指定数值(targetAverageValue)进行扩缩容。targetAverageValue 用于计算所有相关 pods 上的 metrics 的平均值
1
2
3
4
5
6
7
type: Podspods: metric: name: packets-per-second target: type: AverageValue averageValue: 1 k
HPA 从 custom.metrics.k8s.io 获取 custom metrics
object:custom metrics,这类 metrics 描述了相同命名空间下的(非 pod )类型。target 支持通过 value 和 AverageValue 进行扩缩容,前者直接将 metric 与 target 比较进行扩缩容,后者通过 metric/ 相关的 pod 数目与 target 比较进行扩缩容
1
2
3
4
5
6
7
8
9
10
11
type: Objectobject: metric: name: requests-per-second describedObject: apiVersion: extensions/v1beta1 kind: Ingress name: main-route target: type: Value value: 2 k
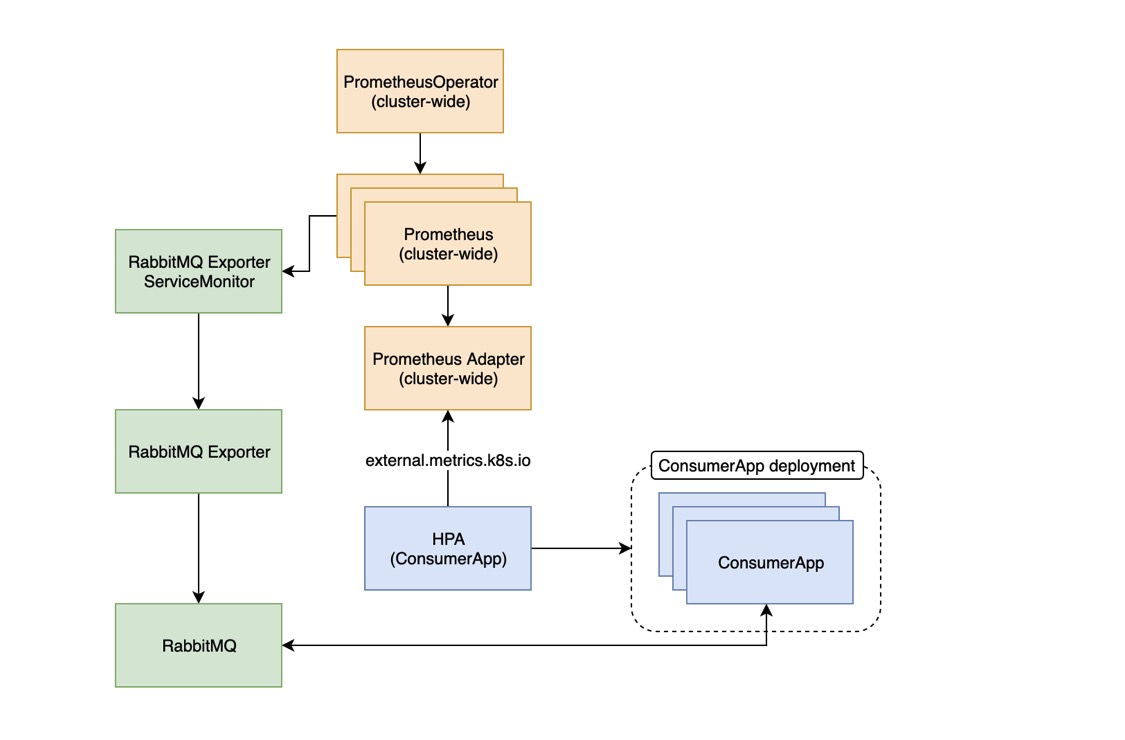
external:kubernetes 1.10+支持的新功能。通常 Prometheus 能够直接从 RabbitMQ 中抓取指标。不幸的是,RabbitMQ的指标端点并没有包含queue length指标。为了收集这些数据,我们使用了RabbitMQ Exporter. 一旦我们将它连接到 RabbitMQ,我们将拥有大量的 RabbitMQ 指标,我们可以将其用作扩展的基础,然后将它们存储在其时间序。Prometheus 能够抓取这些指标列数据库中。 prometheus 中以rabbitmq_queue开头的任何指标都可以通过这个新的 external.metrics.k8s.io API 以 1 分钟间隔的速率形式提供。(也就是说 任何pod都可以用这些值来实现pod扩容,哪怕是两个业务毫无关系。但前提是需要把他注册到api-resources)
custom.metrics.k8s.io 只支持pod 本身metrics指标来扩容
external.metrics.k8s.io 可以是其它业务pod 根据这个值来扩容(例如我可以用nginx的指标值来扩 mysql,也可以用mysql_exporter的值 来扩mysql。)
例如我们可以用mongo_exporter的连接数来扩容nginx,HPA 从 external.metrics.k8s.io 获取 external metrics
1
2
3
4
5
6
7
8
9
10
11
12
13
14
15
16
17
18
19
20
21
kind : Deployment metadata : name : deployment-firstspec: replicas : 2 template : metadata : labels : app : deployment-first spec : containers : - name: deployment-first image : nginx imagePullPolicy : Always ports : - containerPort: 80 protocol : TCP resources : requests : cpu : "1m" limits : cpu : "100m
1
2
3
4
5
6
7
8
9
10
11
12
13
14
15
16
17
18
19
20
21
22
23
apiVersion: autoscaling/v2beta1kind: HorizontalPodAutoscalermetadata: name: app-server-mongo-conn-hpaspec: scaleTargetRef: apiVersion: apps/v1 kind: Deployment name: deployment-first minReplicas: 2 maxReplicas: 5 metrics: external: name: mongodb_current_connection selector: matchLabels: queue: "worker_tasks" target: type: AverageValue averageValue: 30
1
2
3
4
5
6
7
8
9
10
11
12
13
14
15
16
17
18
19
externalRules : - seriesQuery: '{__name__=~"^.*_queue_(length|size)$",namespace!=""}' resources : overrides : namespace : resource : namespace name : matches : ^.*_queue_(length|size)$ as : "$0" metricsQuery : max(<<.Series>>{<<.LabelMatchers>>}) - seriesQuery: '{__name__=~"^.*_queue$",namespace!=""}' resources : overrides : namespace : resource : namespace name : matches : ^.*_queue$ as : "$0" metricsQuery : max(<<.Series>>{<<.LabelMatchers>>})
被上面的规则匹配到的指标会注册为一个新的资源对象
1 2 3 4 5 6 7 8 9 10 11 12 13 14 [root@k8s-master-01 ~]# kubectl api-resourcesfalse IPAMHandlefalse IPPooltrue NetworkPolicytrue NetworkSetio true Eventtrue Ingressio true ExternalMetricValueListio true ExternalMetricValueListio true ExternalMetricValueListio false NodeMetricsio true PodMetrics
1 2 3 4 5 6 7 8 9 10 11 12 13 14 15 16 17 18 19 20 21 22 23 24 25 26 27 28 29 30 31 32 33 34 35 36 37 38 39 40 41 42 43 44 45 46 47 [root@k8s -master-01 ~]# kubectl get --raw "/apis/external.metrics.k8s.io/v1beta1/namespaces/monitoring/node_cpu_core_throttles_total" | jq . "kind" : "ExternalMetricValueList" ,"apiVersion" : "external.metrics.k8s.io/v1beta1" ,"metadata" : {},"items" : ["metricName" : "node_cpu_core_throttles_total" ,"metricLabels" : {"__name__" : "node_cpu_core_throttles_total" ,"app_kubernetes_io_name" : "node-exporter" ,"app_kubernetes_io_version" : "v1.2.2" ,"container" : "node-exporter" ,"core" : "0" ,"endpoint" : "https" ,"instance" : "172.16.50.1:9100" ,"job" : "node-exporter" ,"namespace" : "monitoring" ,"package" : "0" ,"pod" : "node-exporter-8hchf" ,"service" : "node-exporter" ,"service_name" : "node-exporter-172.16.50.1" "timestamp" : "2021-12-23T08:21:49Z" ,"value" : "0" "metricName" : "node_cpu_core_throttles_total" ,"metricLabels" : {"__name__" : "node_cpu_core_throttles_total" ,"app_kubernetes_io_name" : "node-exporter" ,"app_kubernetes_io_version" : "v1.2.2" ,"container" : "node-exporter" ,"core" : "0" ,"endpoint" : "https" ,"instance" : "172.16.50.29:9100" ,"job" : "node-exporter" ,"namespace" : "monitoring" ,"package" : "0" ,"pod" : "node-exporter-mfwxl" ,"service" : "node-exporter" ,"service_name" : "node-exporter-172.16.50.29" "timestamp" : "2021-12-23T08:21:49Z" ,"value" : "0"
Kubernetes metrics 的获取 假设注册的 APIService为custom.metrics.k8s.io/v1beta1,在注册好APIService 后 HorizontalPodAutoscaler controller 会从以 /apis/custom.metrics.k8s.io/v1beta1 为根 API 的路径上抓取 metrics。metrics 的 API path 可以分为 namespaced 和 non-namespaced 类型的。通过如下方式校验 HPA 是否可以获取到 metrics:
namespaced 获取指定 namespace 下指定 object 类型和名称的 metrics
1 kubectl get --raw "/apis/custom.metrics.k8s.io/v1beta1/namespaces/ {namespace-name} / {object-type} / {object-name} / {metric-name...} " | jq .
如获取 monitor 命名空间下名为 grafana 的 pod 的start_time_seconds metric
1 kubectl get --raw "/apis/custom.metrics.k8s.io/v1beta1/namespaces/monitor/pods/grafana/start_time_seconds" | jq .
获取指定 namespace 下所有特定 object 类型的 metrics
1 kubectl get --raw "/apis/custom.metrics.k8s.io/v1beta1/namespaces/{namespace-name}/pods/*/{metric-name...}" | jq .
如获取 monitor 命名空间下名为所有 pod 的 start_time_seconds metric
1 kubectl get --raw "/apis/custom.metrics.k8s.io/v1beta1/namespaces/monitor/pods/*/start_time_seconds" | jq .
使用 labelSelector 可以选择带有特定 label 的 object
1 kubectl get --raw "/apis/custom.metrics.k8s.io/v1beta1/namespaces/ {namespace-name} / {object-type} / {object-name} / {metric-name...} ?labelSelector= {label-name} " | jq .
1 kubectl get --raw "/apis/custom.metrics.k8s.io/v1beta1/namespaces/ {namespace-name} /pods/*/ {metric-name...} ?labelSelector= {label-name} " | jq .
non-namespaced non-namespaced 和 namespaced 的类似,主要有 node,namespace,PersistentVolume 等。non-namespaced 访问有些与 custom metrics API 描述不一致。
访问 object 为 namespace 的方式如下如下
1 kubectl get --raw "/apis/custom.metrics.k8s.io/v1beta1/namespaces/{namespace-name}/metrics/{metric-name...}" | jq .
1 kubectl get --raw "/apis/custom.metrics.k8s.io/v1beta1/namespaces/*/metrics/{metric-name...}" | jq .
访问 node 的方式如下
1 kubectl get --raw "/apis/custom.metrics.k8s.io/v1beta1/nodes/{node-name}/{metric-name...}" | jq .
示例 1 2 3 4 5 6 7 8 9 10 11 12 13 14 15 16 17 18 19 20 21 22 23 24 25 26 27 28 29 30 31 32 33 34 35 36 37 38 39 40 41 42 43 44 45 46 47 48 49 50 51 52 53 54 55 56 57 58 59 60 61 62 63 64 65 66 67 68 69 70 71 --- apiVersion: v1 kind: Service metadata: name: sample-app labels: app: sample-app annotations: prometheus.io/scrape: "true" prometheus.io/port: "8080" spec: ports: - name: http port: 8080 targetPort: 8080 selector: app: sample-app --- apiVersion: apps/v1 kind: Deployment metadata: name: sample-app labels: app: sample-app spec: replicas: 1 selector: matchLabels: app: sample-app template: metadata: labels: app: sample-app istio: ingressgateway version: v1 annotations: sidecar.istio.io/inject: "true" spec: containers: - image: luxas/autoscale-demo:v0.1.2 name: metrics-provider resources: requests: memory: "256Mi" cpu: "500m" limits: memory: "256Mi" cpu: "500m" ports: - name: http containerPort: 8080 --- apiVersion: autoscaling/v2 kind: HorizontalPodAutoscaler metadata: name: sample-app spec: maxReplicas: 10 metrics: - pods: metric: name: http_requests target: averageValue: 500m type: AverageValue type: Pods minReplicas: 2 scaleTargetRef: apiVersion: apps/v1 kind: Deployment name: sample-app
HPA在k8s中的结构 首先可以看一下HPA在k8s中的结构,这里找了一个k8s官方给出的HPA例子,我在关键字段上给出一些注释方便理解。
1
2
3
4
5
6
7
8
9
10
11
12
13
14
15
16
17
18
19
20
21
22
23
24
25
26
27
28
29
30
31
32
33
34
35
36
37
38
39
40
41
42
43
44
45
46
47
48
49
50
51
52
53
54
55
56
57
58
59
60
61
62
apiVersion : autoscaling/v2beta2 kind : HorizontalPodAutoscaler metadata : name : php-apache namespace : default spec : scaleTargetRef : apiVersion : apps/v1 kind : Deployment name : php-apache minReplicas : 1 maxReplicas : 10 metrics : - type: Object object : metric : name : requests-per-second describedObject : apiVersion : networking.k8s.io/v1beta1 kind : Ingress name : main-route target : type : Value value : 10k - type: Resource resource : name : cpu target : type : Utilization averageUtilization : 50 - type: Pods pods : metric : name : packets-per-second target : type : AverageValue averageValue : 1k - type: External external : metric : name : queue_messages_ready selector : matchLabels : env : "stage" app : "myapp" target : type : AverageValue averageValue : 30
根据前面 adapter 中的配置文件去匹配,从上往下匹配,匹配到那条规则就用有那条规则做计算。
1 2 3 4 5 6 7 8 9 10 11 12 13 14 15 16 17 18 19 20 21 22 [root@k8s -master-01 prometheus-adapter]# kubectl get --raw "/apis/custom.metrics.k8s.io/v1beta1/namespaces/default/pod/*/http_requests" | jq . "kind" : "MetricValueList" ,"apiVersion" : "custom.metrics.k8s.io/v1beta1" ,"metadata" : {"selfLink" : "/apis/custom.metrics.k8s.io/v1beta1/namespaces/default/pod/%2A/http_requests" "items" : ["describedObject" : {"kind" : "Pod" ,"namespace" : "default" ,"name" : "sample-app-b7b48448c-ljk2f" ,"apiVersion" : "/v1" "metricName" : "http_requests" ,"timestamp" : "2021-12-24T03:07:20Z" ,"value" : "100m" ,"selector" : null
被此规则匹配到
1
2
3
4
5
6
7
8
9
- seriesQuery: '{namespace!="",__name__!~"^container_.*"}' seriesFilters : - isNot: .*_seconds_total resources : template : <<.Resource>> name : matches : ^(.*)_total$ as : "" metricsQuery : sum(rate(<<.Series>>{<<.LabelMatchers>>}[1m])) by (<<.GroupBy>>)
1 2 3 4 5 6 [root@k8s-master-01 prometheus-adapter]2.3 <$Revision : 1430300 $>1996 Adam Twiss, Zeus Technology Ltd, http:// www.zeustech.net/// www.apache.org/10.96 .152.103 (be patient)
1 2 3 4 [root@k8s - master-01 ~ ]# kubectl get pod- client- provisioner-7 b889f4bc9- rb9xj 1 / 1 Running 2 222 d- app- b7b48448c- ljk2f 1 / 1 Running 0 54 m
成功扩容
1
2
3
4
5
6
7
8
9
10
11
12
13
[root@k8s-master-01 ~]# kubectl get pod -wsample -app -b7b48448c-2dlvm 1/1 Running 0 81ssample -app -b7b48448c-9tm79 1/1 Running 0 66ssample -app -b7b48448c-9xzmb 1/1 Running 0 82ssample -app -b7b48448c-h6lj6 1/1 Running 0 82ssample -app -b7b48448c-jvpgn 1/1 Running 0 98ssample -app -b7b48448c-knzh9 1/1 Running 0 66ssample -app -b7b48448c-ljk2f 1/1 Running 0 56msample -app -b7b48448c-qhtgp 1/1 Running 0 98ssample -app -b7b48448c-tc89k 1/1 Running 0 82ssample -app -b7b48448c-vgn8n 1/1 Running 0 98s